Graphics at a glance
Power Graphics
 |
 |
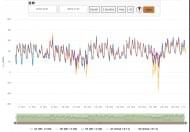 |
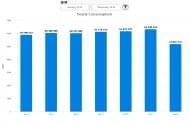
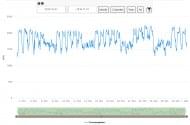
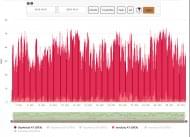
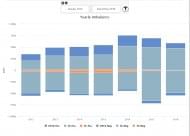
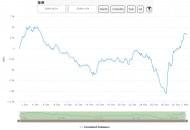
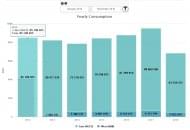
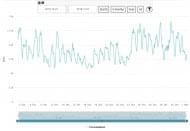
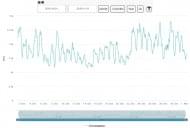
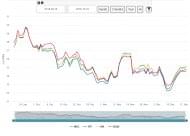
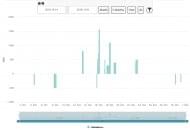
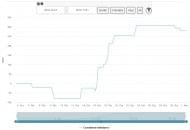
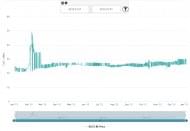
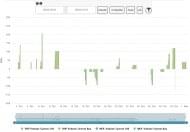
| Aggregate Consumption | Consumption per 15 minutes | Day Ahead Prices |
 |
 |
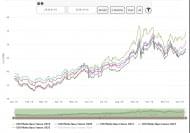 |
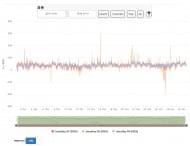
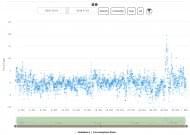
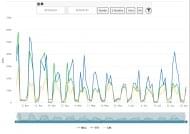
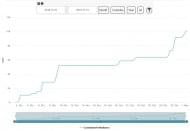
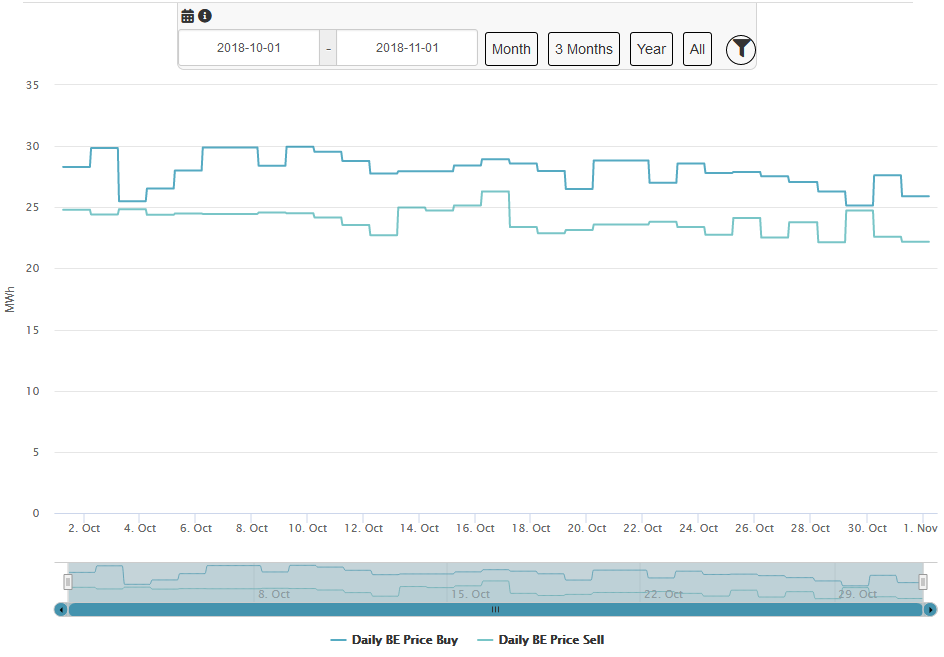
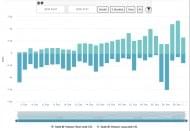
| Intraday Prices | Exchange Volumes | Future Base Year Prices |
 |
 |
 |
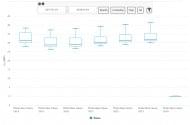
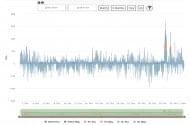
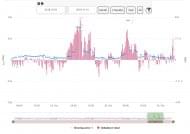
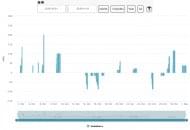
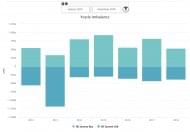
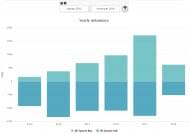
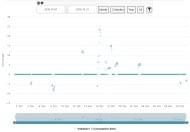
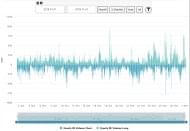
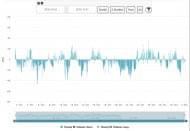
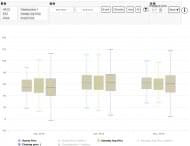
| Future Base Year as Boxplot | Imbalance in 15 minutes | Aggregated Imbalance |
 |
 |
 |
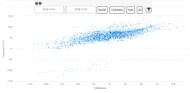
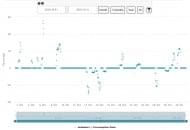
| Accumulation of Imbalance | Imbalance/Consumption Ratio | Set. Price & Imbalance |
 |
 |
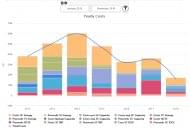 |
| Set. Price @ Imbalance | Set. Price & Spot Prices | Balancing Costs |
 |
||
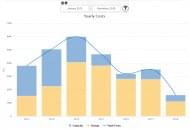
| Energy vs. Capacity Costs |
Gas Graphics
 |
 |
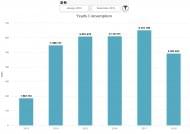 |
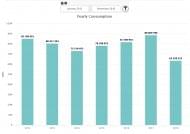
| Aggregated Consumption Austria | Aggregated Consumption East | Aggregated Consumption West |
 |
 |
 |
| Consumption per Hour Austria | Consumption per Hour East | Consumption per Hour West |
 |
 |
 |
| Daily Reference Price | Daily Refenence Volume | Imbalance per Hour East |
 |
 |
 |
| Imbalance per Hour West | Aggregated Imbalance East | Aggregated Imbalance West |
 |
 |
 |
| Accumulated Imbalance East | Accumulated Imbalance West | Imbalance/Consumption Ratio East |
 |
 |
 |
| Imbalance/Consumption Ratio West | Hourly Balanced Prices East | Hourly Balanced Prices West |
 |
 |
 |
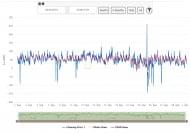
| Daily Balanced Prices East | Daily Balanced Prices West | Balancing Prices 2012 |
 |
 |
 |
| Hourly Balanced Volumes East | Hourly Balanced Volumes West | Daily Volume with CEL East |
 |
 |
 |
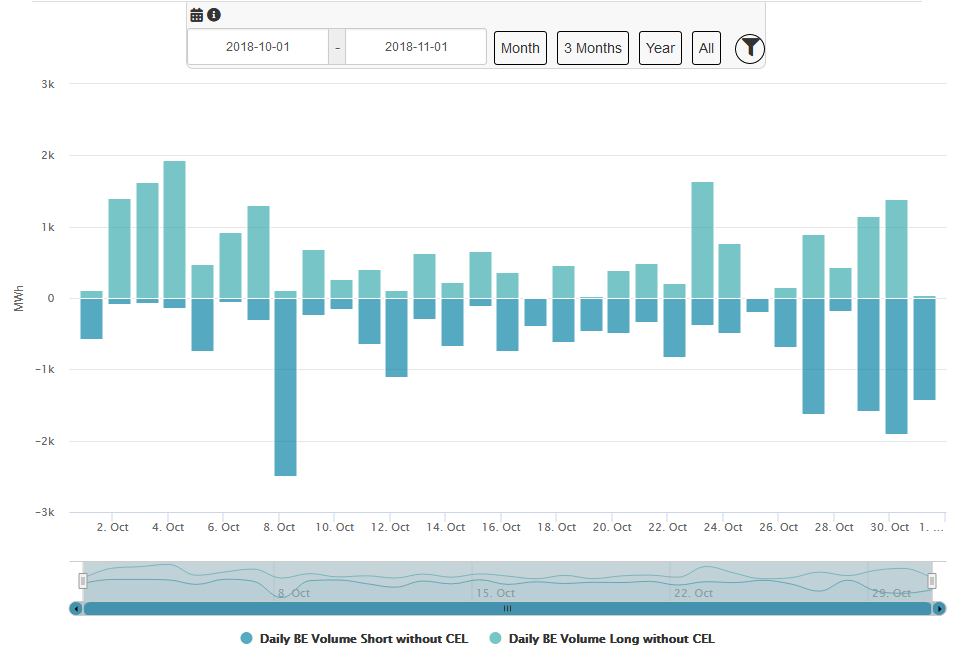
| Daily Volume with CEL West | Daily Volume without CEL East | Daily Volume without CEL West |
 |
 |
|
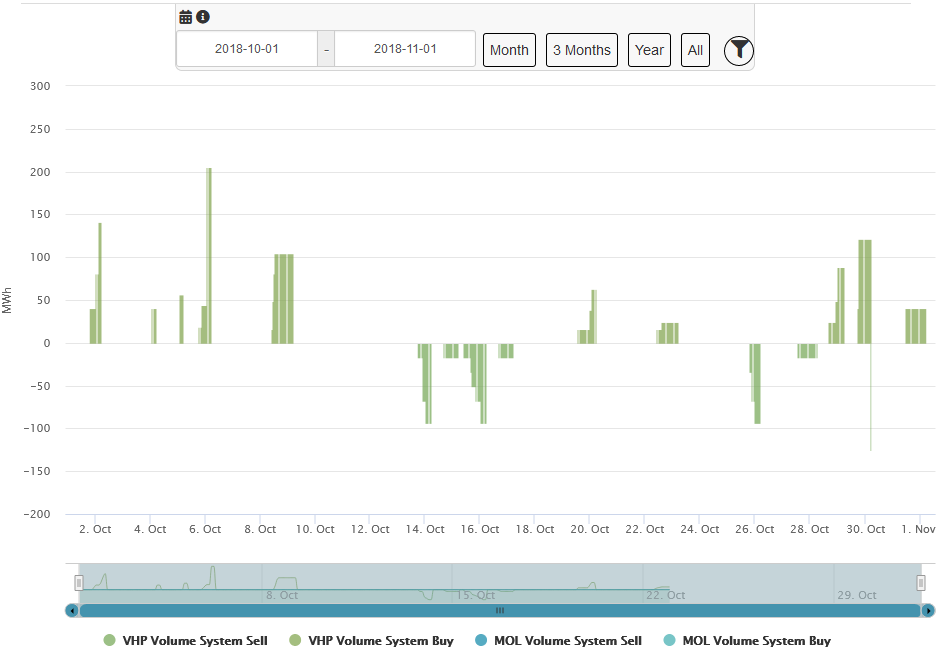
| Calls on VHP and MOL East | Calls on VHP and MOL West |
Timeseries
 |
 |
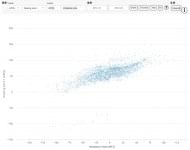 |
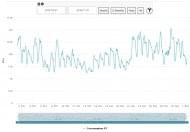
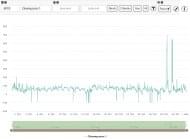
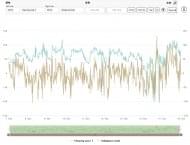
| Single Axis | Dual Axis | Correlation |
 |
 |
|
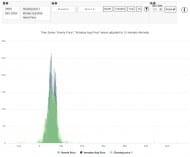
| Boxplot | Histogram |